Benchmarks: R5 3600 vs R5 5600 vs R7 5800X3D
A brief comparison of the Ryzen 5 3600, 5600, and Ryzen 7 5800X3D (with legacy 1800X results).
I have bounced between a lot of Ryzen CPUs during my time in this hobby, and at (almost) every step I have taken the time to compare the difference between each of my upgrades. My latest CPU, the Ryzen 9 5900X, being the exception to this.
Below you will find a collation of my testing results over time. From my first upgrade from the 1800X to a 3600 in October 2020, to my short time with the 5800X3D in December 2022.
Methodology
Testing methodology is not fully consistent between these CPUs, and any results using a different GPU are in separate categories/graphs. As such, please take them with a grain truckload of salt.
I can say however that all results were captured using RTSS, with the resulting CSVs being processed in Python and then eventually making some custom graphs in Excel because I couldn’t be bothered making a template in Python. Would have been handy if I did though…
System Specifications
- CPU: Device Under Test
- Memory: G.Skill Ripjaws V, 2x16GB, 3600MHz
- tCAS 16, tRCD 19, tRP 19, tRAS 39
- FCLK & MCLK = 1:1
- Motherboard: Asus Strix ROG X570-F
- GPU: EVGA GTX 1070 FTW / Gigabyte RTX 3080 Gaming OC
- Operating System: Windows 10 Home
Results
Gaming (RTX 3080)
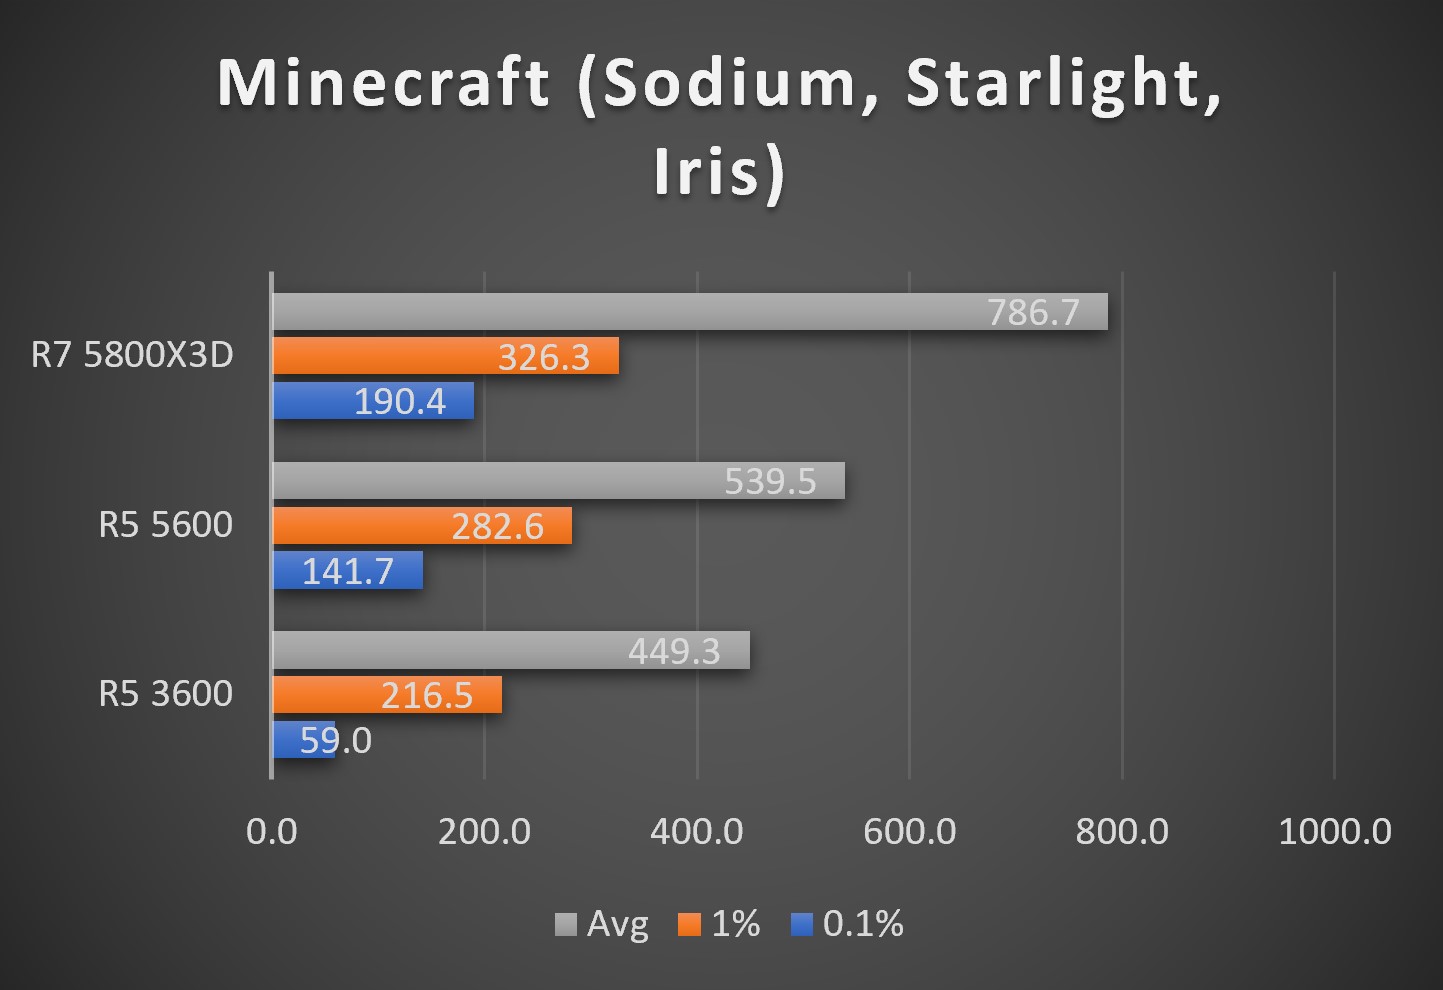
Minecraft (Sodium, Starlight, Iris)
| FPS | R7 5800X3D | R5 5600 | R5 3600 |
|---|---|---|---|
| 0.1% | 190.4 | 141.7 | 59.0 |
| 1% | 326.3 | 282.6 | 216.5 |
| Avg | 786.7 | 539.5 | 449.3 |
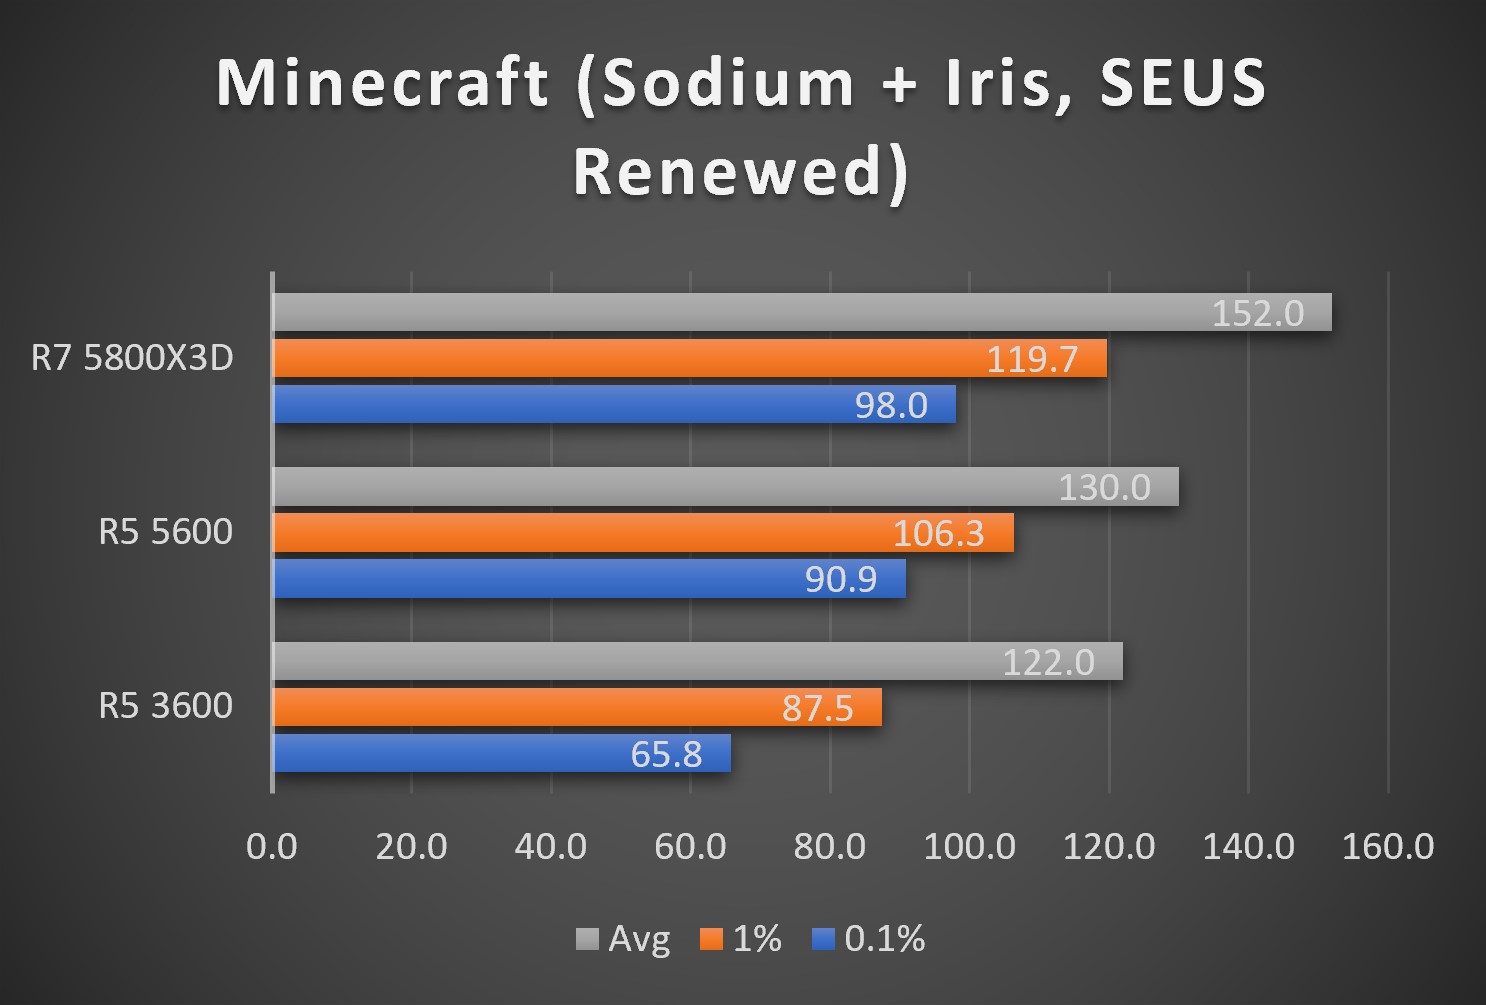
Minecraft (Sodium, Iris, SEUS Renewed)
| FPS | R7 5800X3D | R5 5600 | R5 3600 |
|---|---|---|---|
| 0.1% | 98.0 | 90.9 | 65.8 |
| 1% | 119.7 | 106.3 | 87.5 |
| Avg | 152.0 | 130.0 | 122.0 |
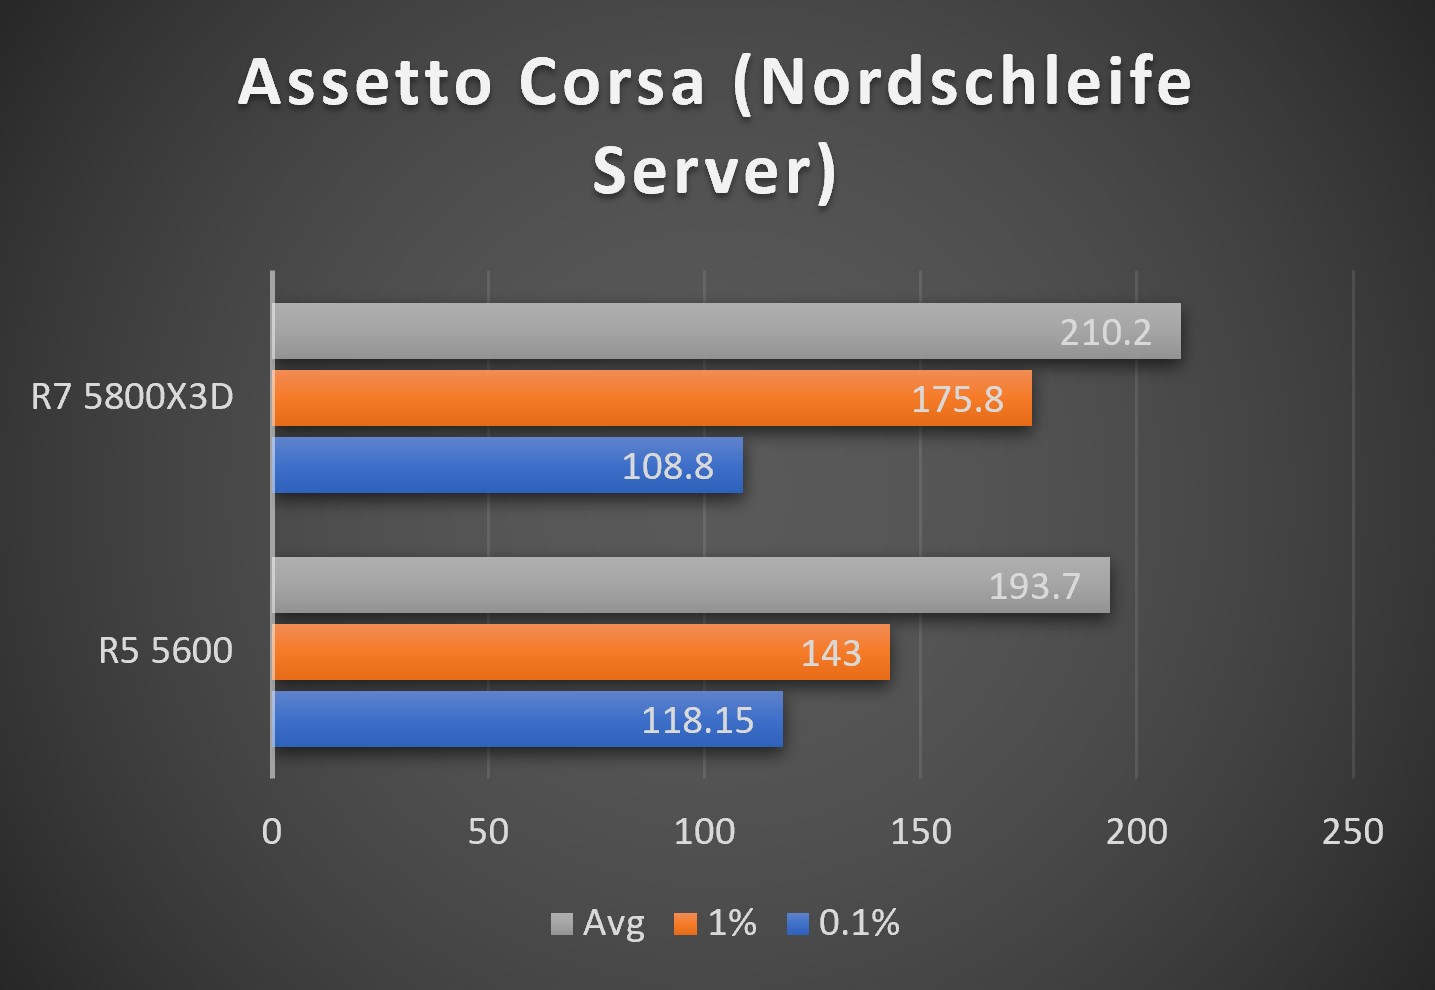
Assetto Corsa (Nordschleife, Public Server)
| R7 5800X3D | R5 5600 | |
|---|---|---|
| 0.1% | 108.8 | 118.2 |
| 1% | 175.8 | 143.0 |
| Avg | 210.2 | 193.7 |
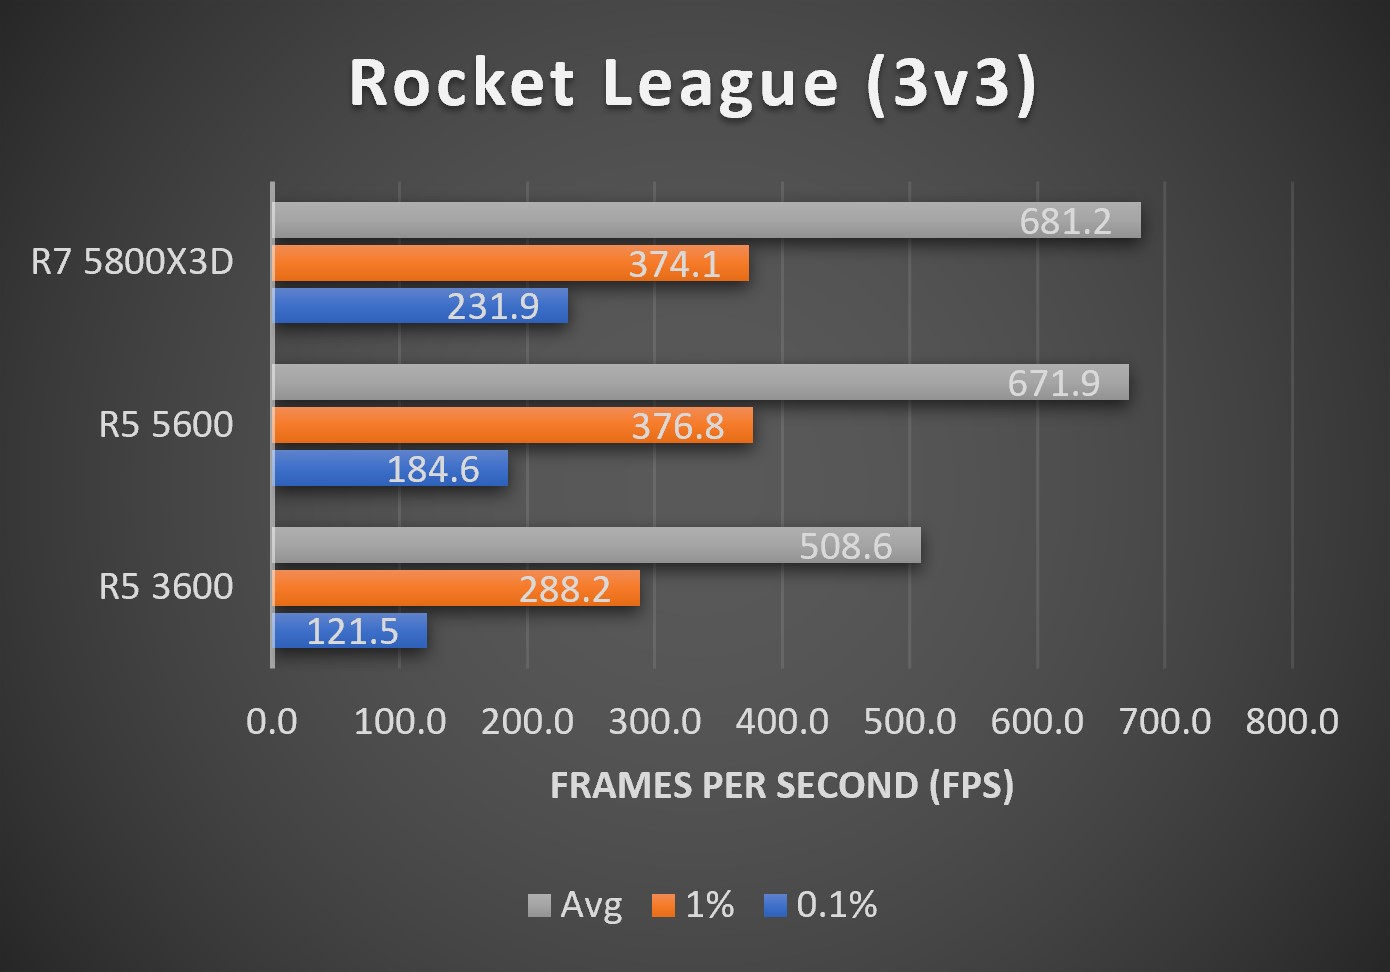
Rocket League (Standard 3v3)
| R7 5800X3D | R5 5600 | R5 3600 | |
|---|---|---|---|
| 0.1% | 231.9 | 184.6 | 121.5 |
| 1% | 374.1 | 376.8 | 288.2 |
| Avg | 681.2 | 671.9 | 508.6 |
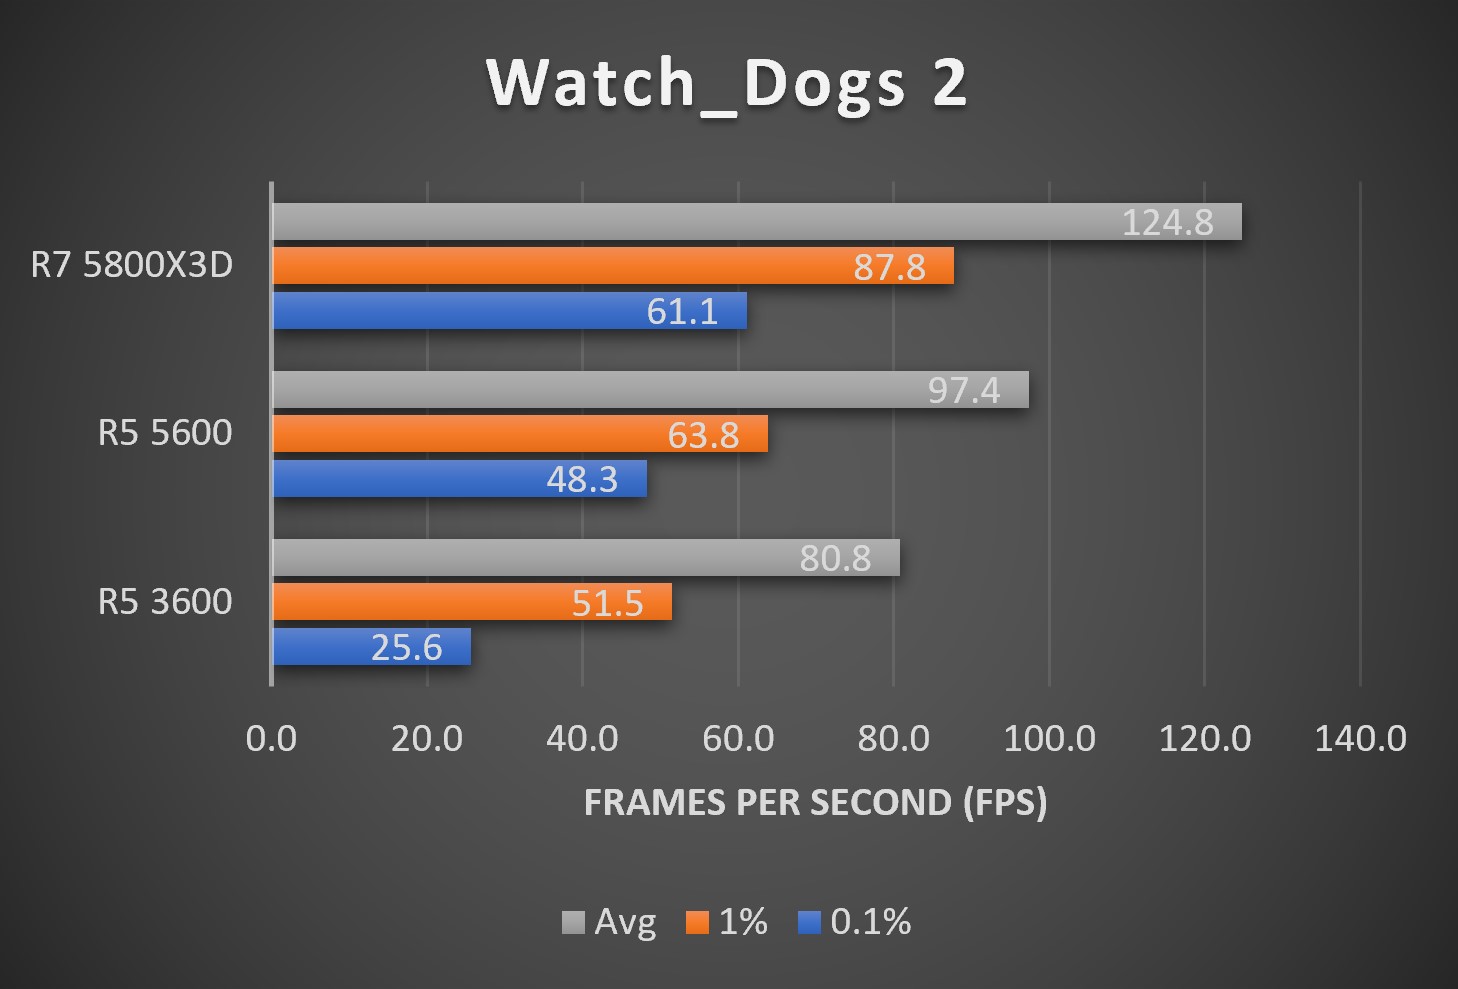
Watch_Dogs 2
| R7 5800X3D | R5 5600 | R5 3600 | |
|---|---|---|---|
| 0.1% | 61.1 | 48.3 | 25.6 |
| 1% | 87.8 | 63.8 | 51.5 |
| Avg | 124.8 | 97.4 | 80.8 |
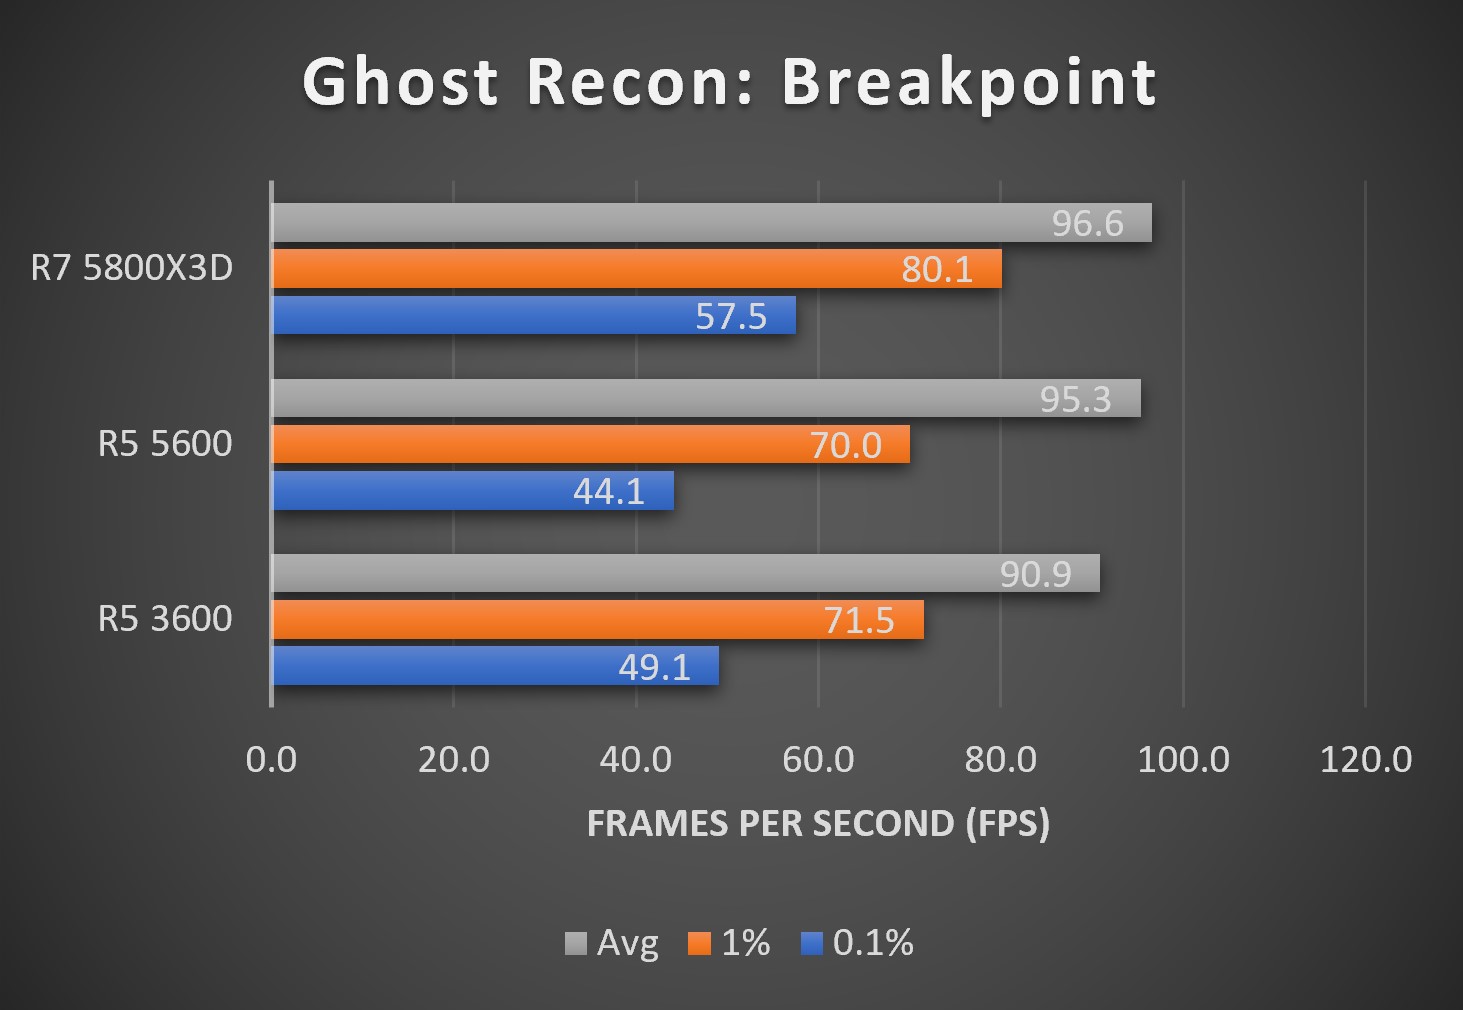
Ghost Recon: Breakpoint
| R7 5800X3D | R5 5600 | R5 3600 | |
|---|---|---|---|
| 0.1% | 57.5 | 44.1 | 49.1 |
| 1% | 80.1 | 70.0 | 71.5 |
| Avg | 96.6 | 95.3 | 90.9 |
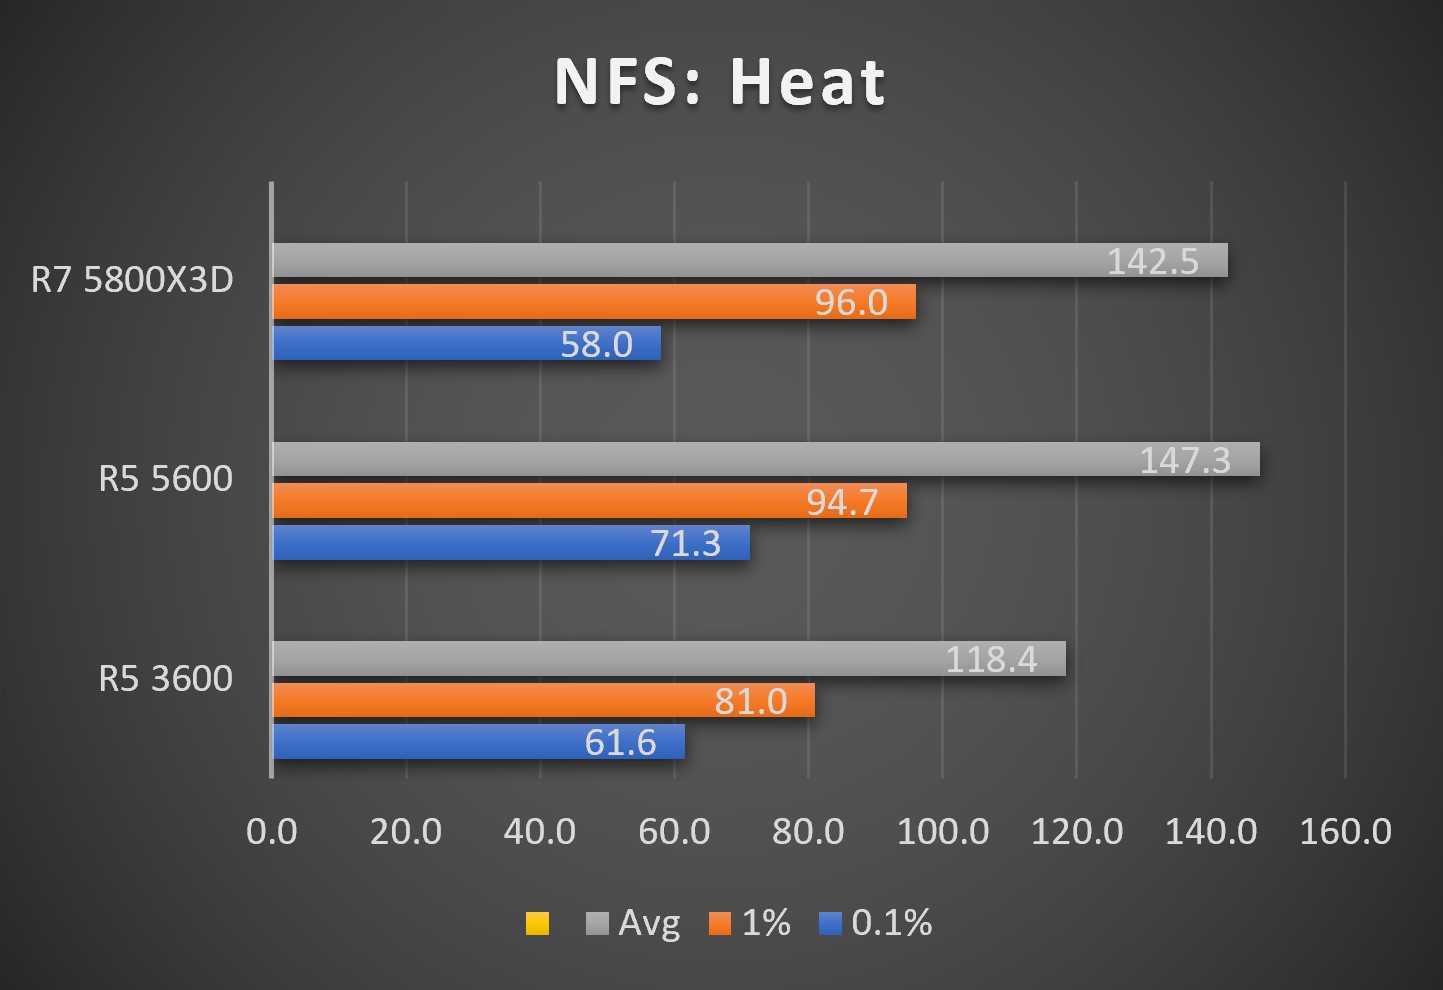
Need For Speed Heat
| R7 5800X3D | R5 5600 | R5 3600 | |
|---|---|---|---|
| 0.1% | 58.0 | 71.3 | 61.6 |
| 1% | 96.0 | 94.7 | 81.0 |
| Avg | 142.5 | 147.3 | 118.4 |
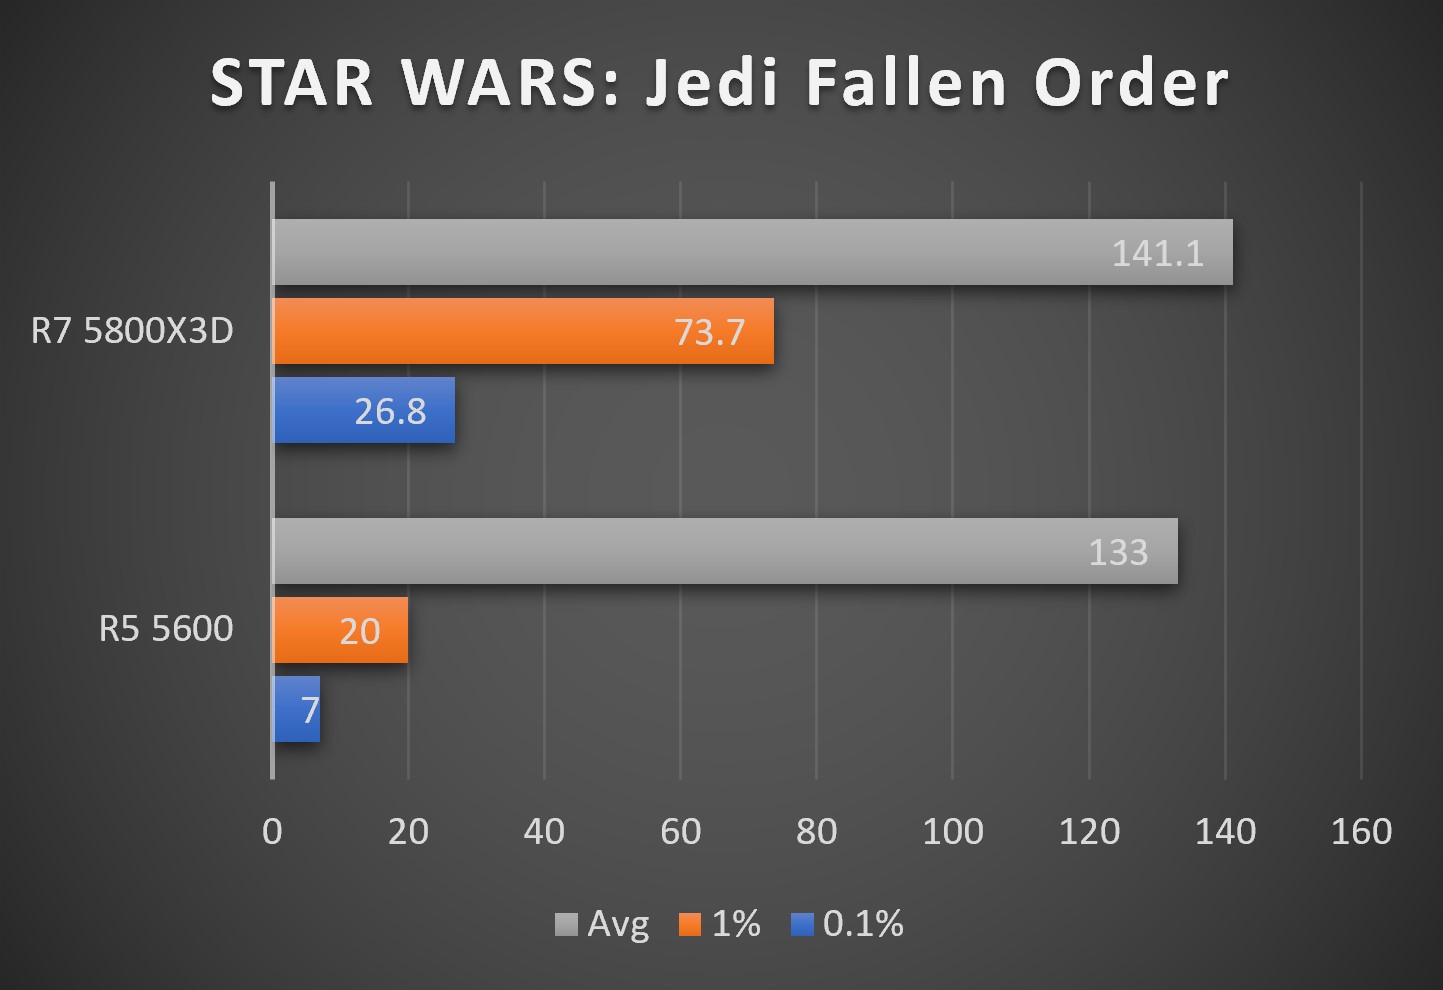
STAR WARS: Jedi Fallen Order
| R7 5800X3D | R5 5600 | |
|---|---|---|
| 0.1% | 26.8 | 7.0 |
| 1% | 73.7 | 20.0 |
| Avg | 141.1 | 133.0 |
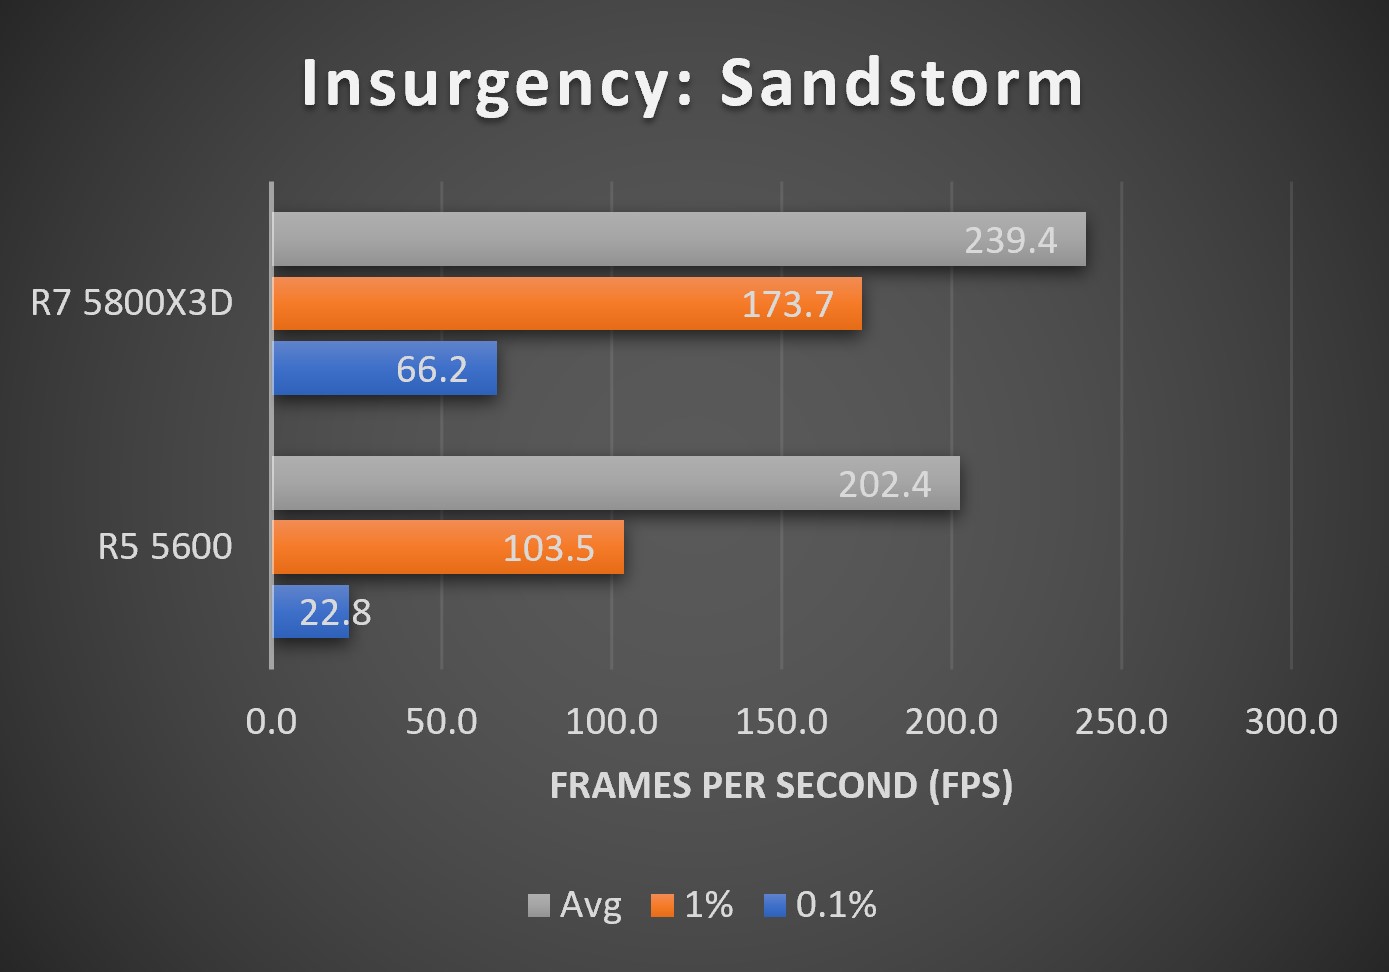
Insurgency Sandstorm
| R7 5800X3D | R5 5600 | |
|---|---|---|
| 0.1% | 66.2 | 22.8 |
| 1% | 173.7 | 103.5 |
| Avg | 239.4 | 202.4 |
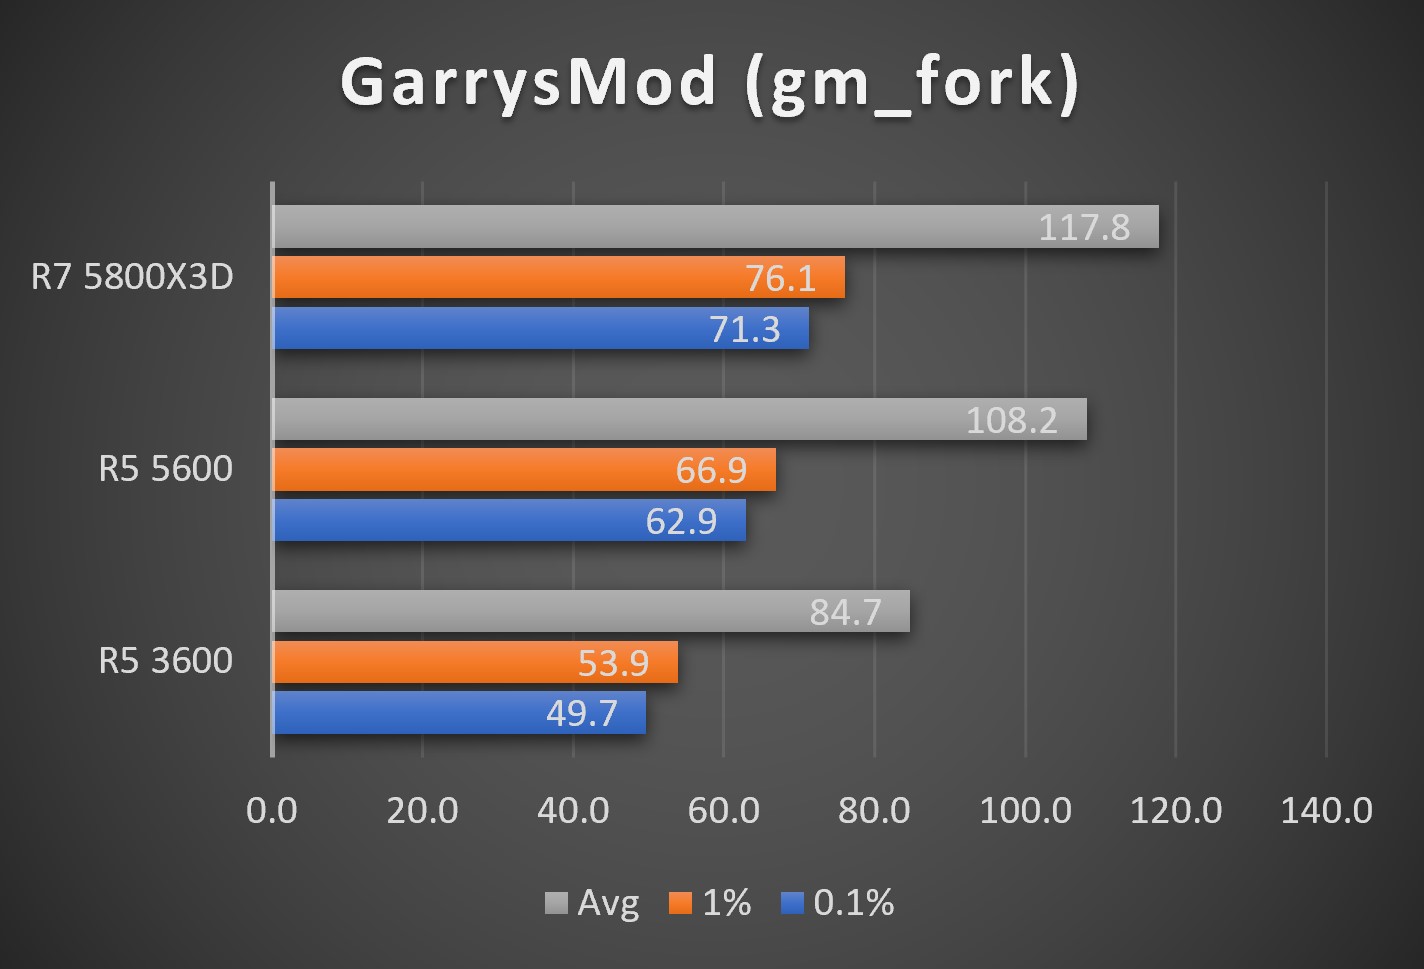
GarrysMod (gm_fork)
| R7 5800X3D | R5 5600 | R5 3600 | |
|---|---|---|---|
| 0.1% | 71.3 | 62.9 | 49.7 |
| 1% | 76.1 | 66.9 | 53.9 |
| Avg | 117.8 | 108.2 | 84.7 |
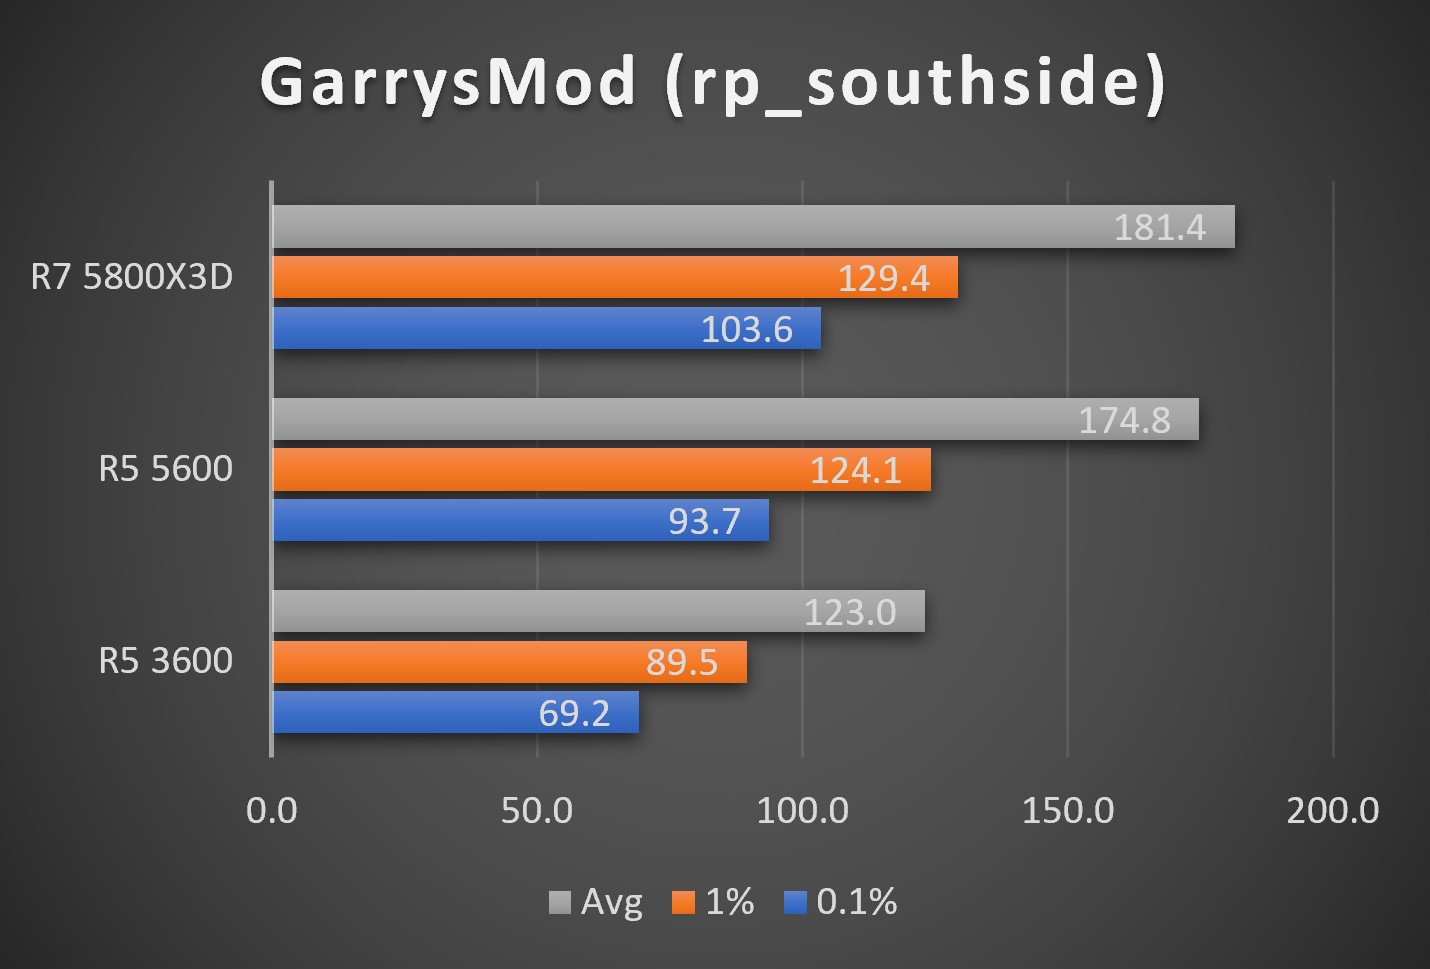
GarrysMod (rp_southside)
| R7 5800X3D | R5 5600 | R5 3600 | |
|---|---|---|---|
| 0.1% | 103.6 | 93.7 | 69.2 |
| 1% | 129.4 | 124.1 | 89.5 |
| Avg | 181.4 | 174.8 | 123.0 |
Legacy (GTX 1070)
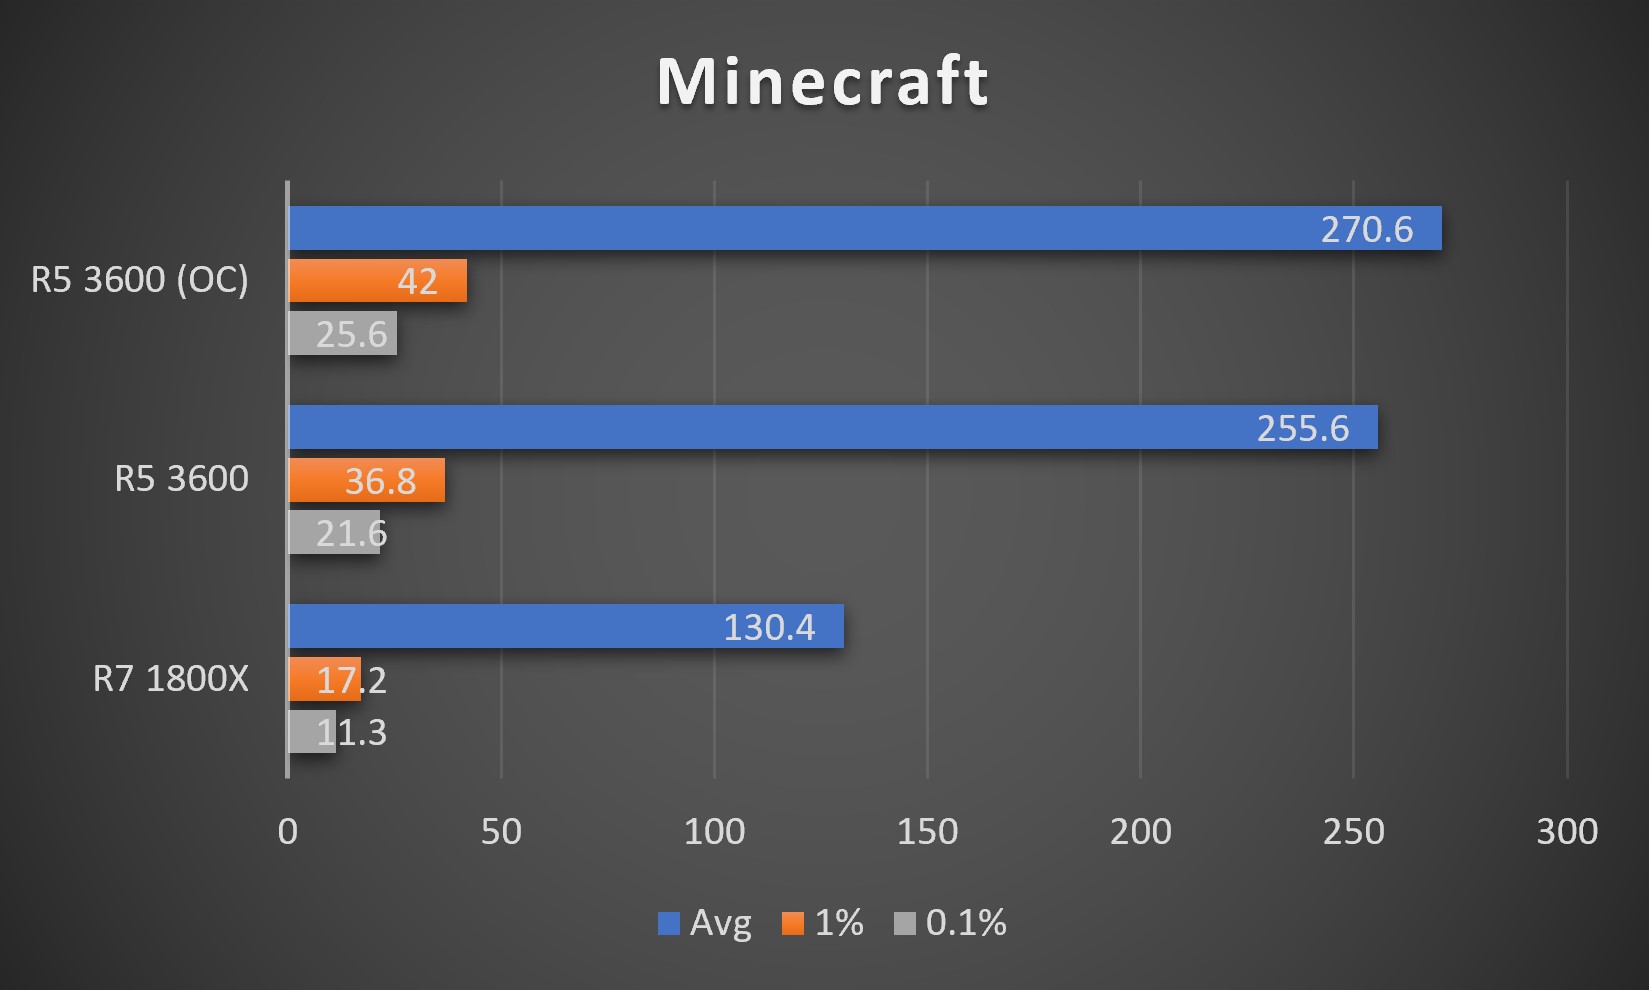
Minecraft (Vanilla)
| R5 3600 (OC) | R5 3600 | R7 1800X | |
|---|---|---|---|
| 0.1% | 25.6 | 21.6 | 11.3 |
| 1% | 42.0 | 36.8 | 17.2 |
| Avg | 270.6 | 255.6 | 130.4 |
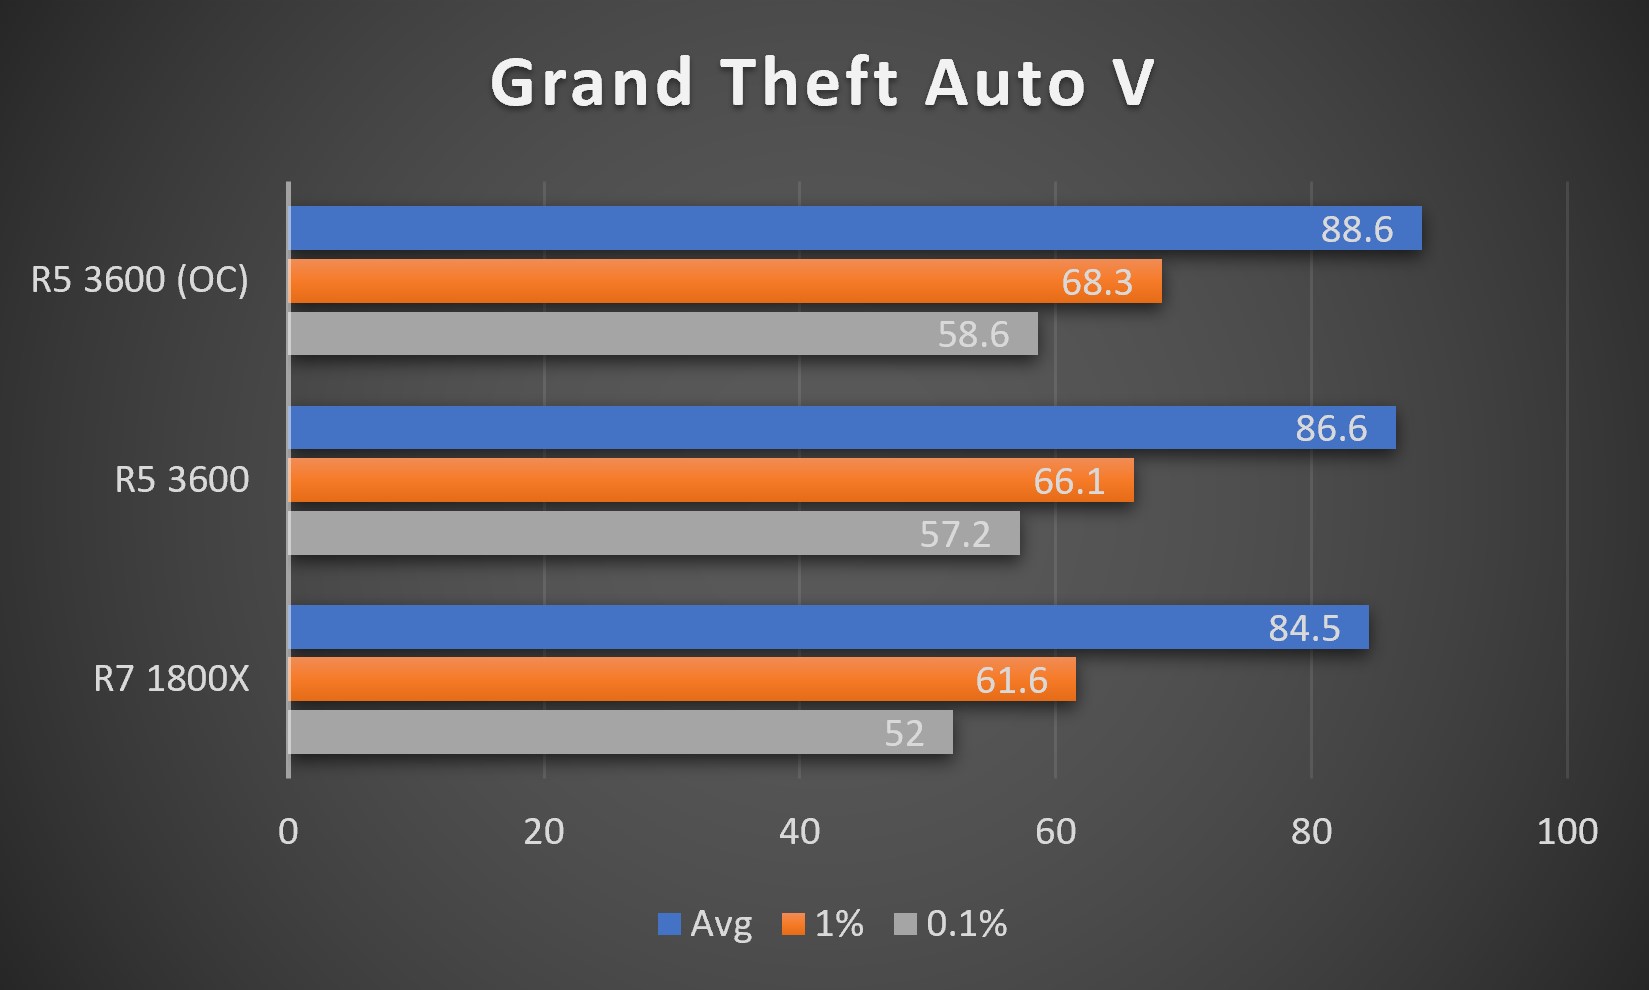
Grand Theft Auto V
| R5 3600 (OC) | R5 3600 | R7 1800X | |
|---|---|---|---|
| 0.1% | 58.6 | 57.2 | 52.0 |
| 1% | 68.3 | 66.1 | 61.6 |
| Avg | 88.6 | 86.6 | 84.5 |
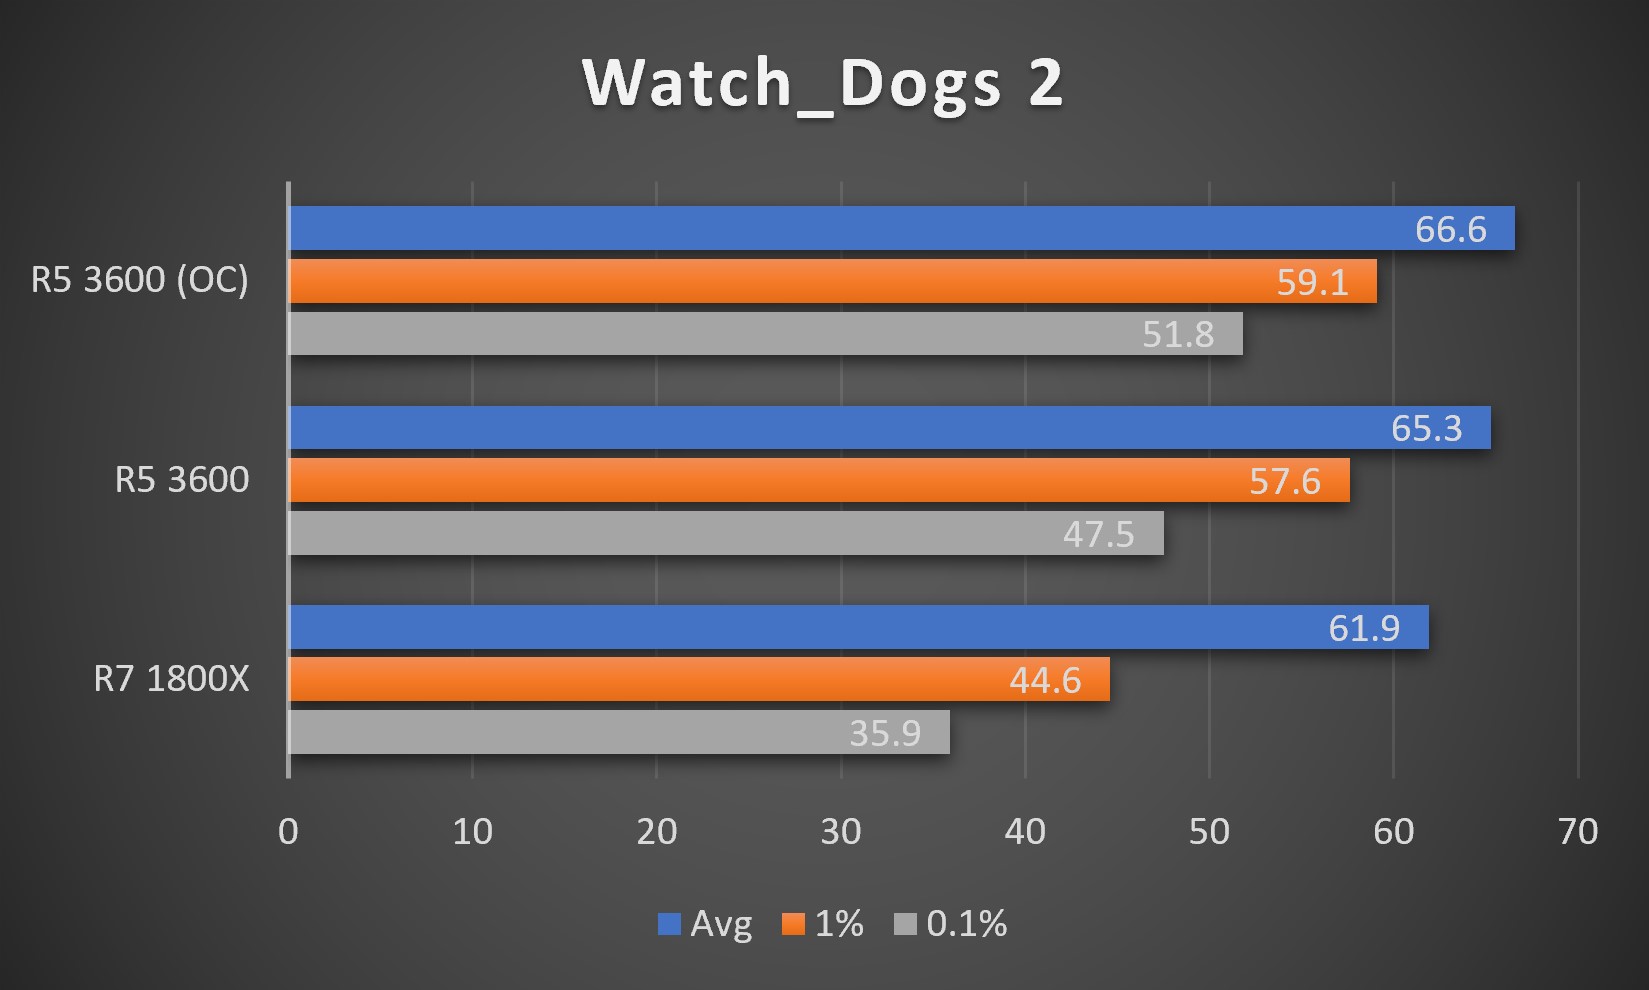
Watch_Dogs 2
| R5 3600 (OC) | R5 3600 | R7 1800X | |
|---|---|---|---|
| 0.1% | 51.8 | 47.5 | 35.9 |
| 1% | 59.1 | 57.6 | 44.6 |
| Avg | 66.6 | 65.3 | 61.9 |
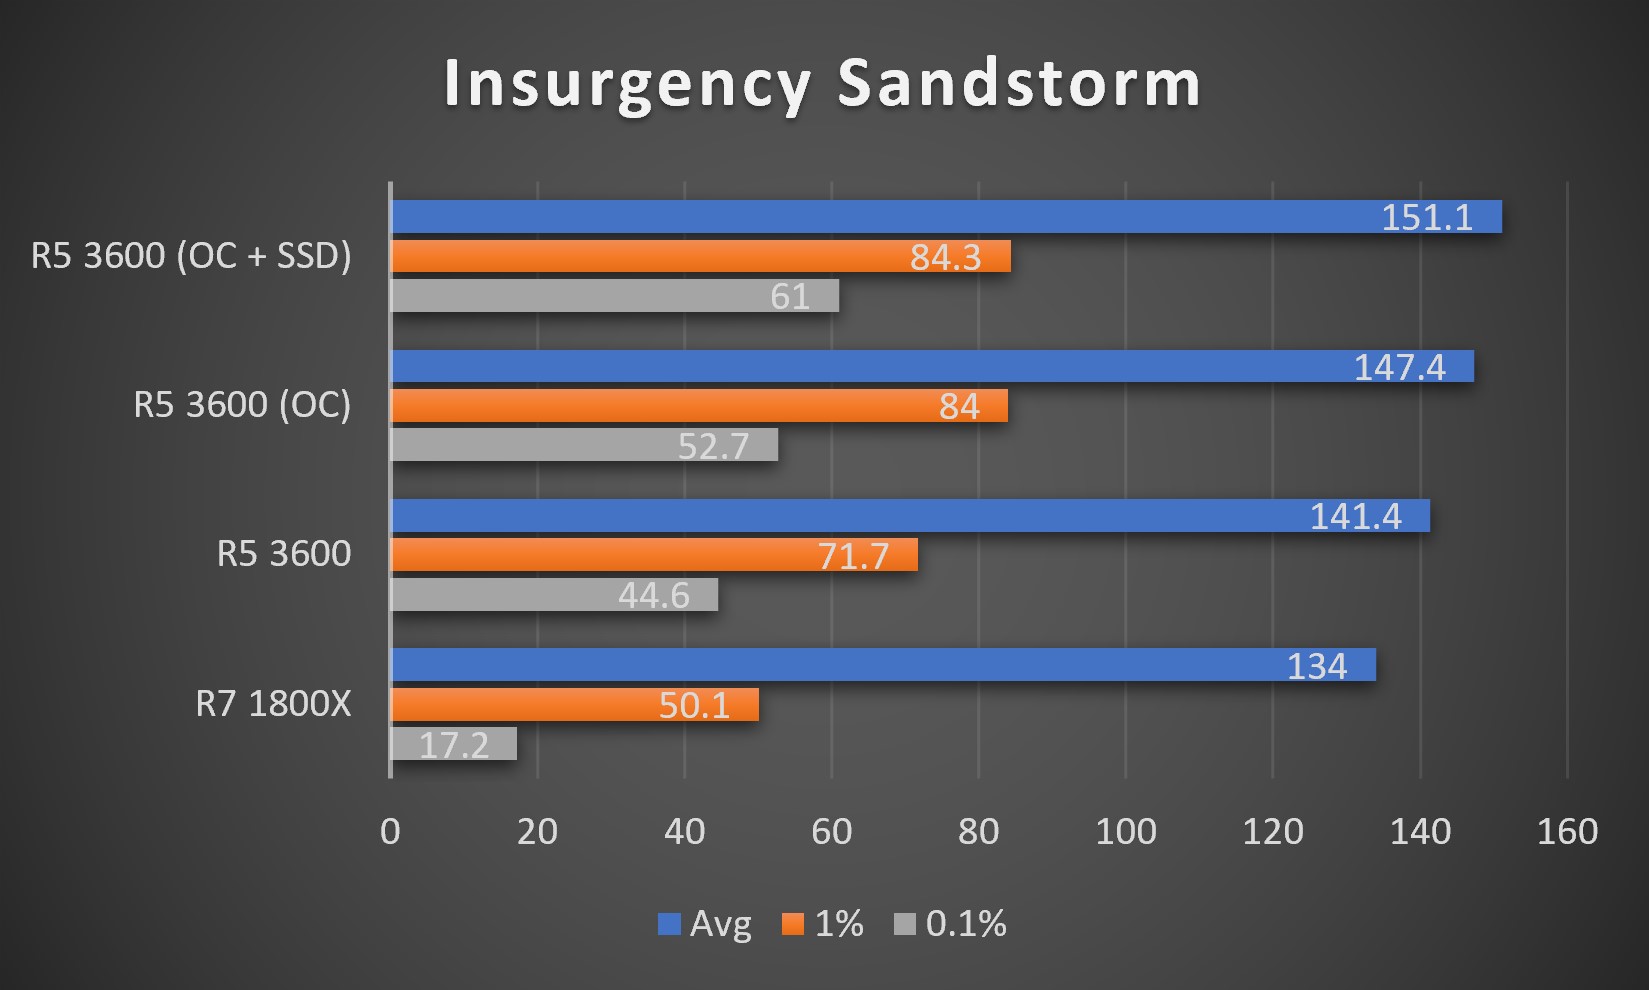
Insurgency Sandstorm
| R5 3600 (OC + SSD) | R5 3600 (OC) | R5 3600 | R7 1800X | |
|---|---|---|---|---|
| 0.1% | 61.0 | 52.7 | 44.6 | 17.2 |
| 1% | 84.3 | 84.0 | 71.7 | 50.1 |
| Avg | 151.1 | 147.4 | 141.4 | 134.0 |
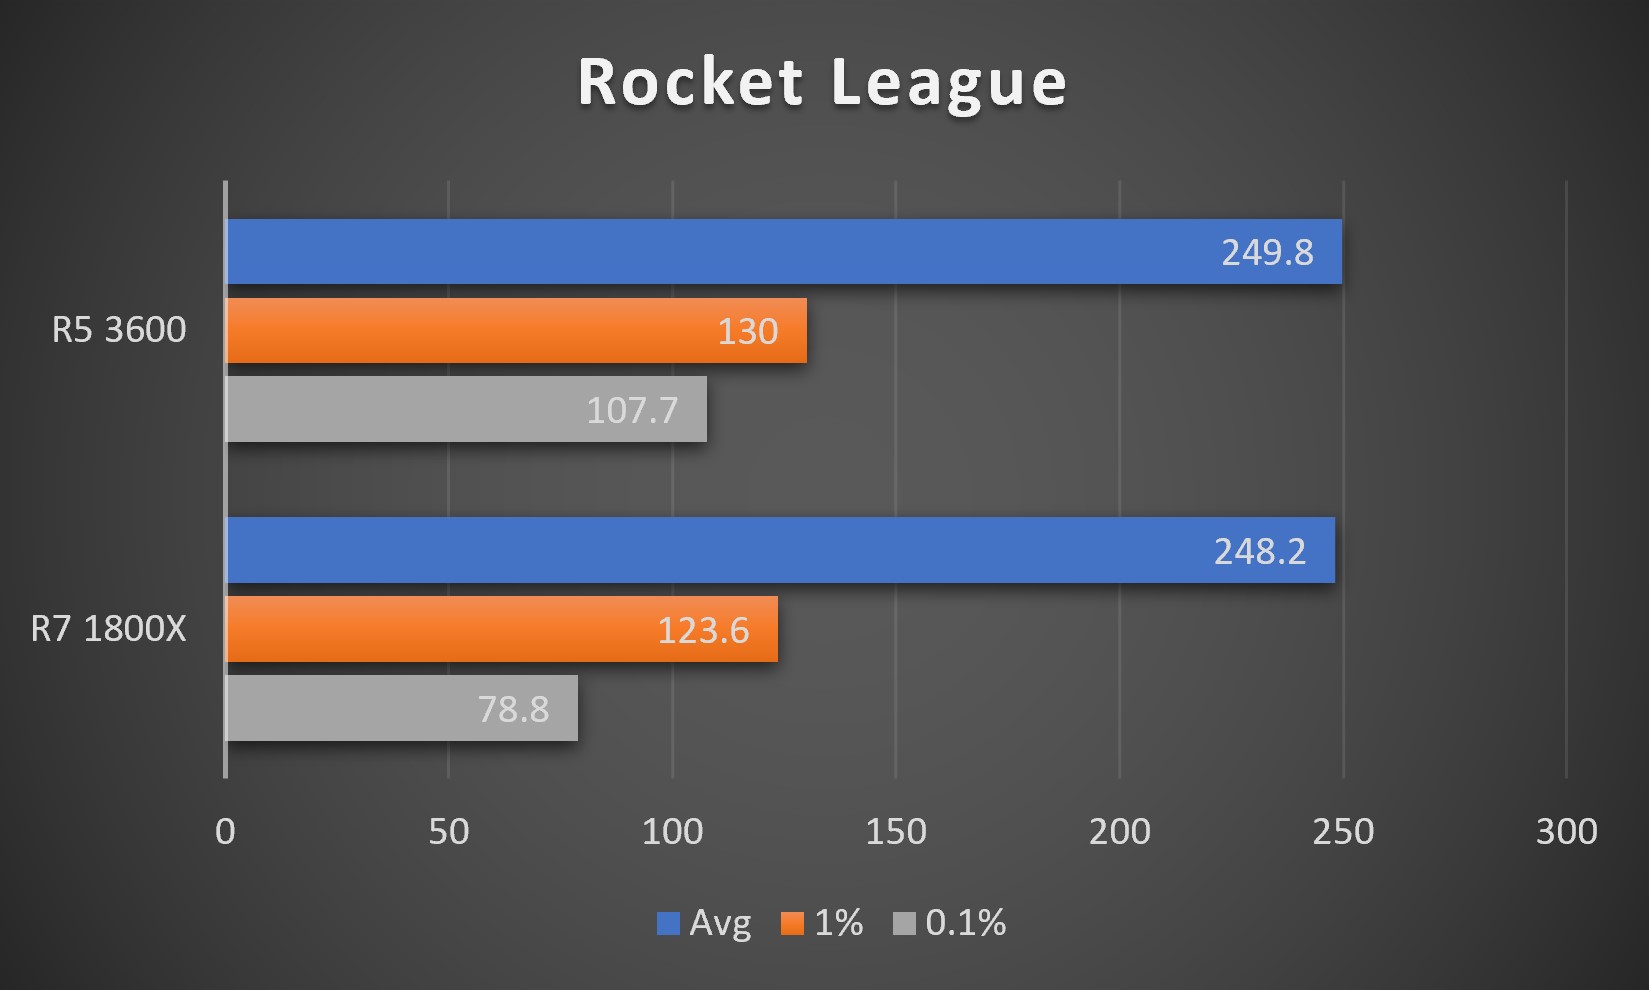
Rocket League
| R5 3600 | R7 1800X | |
|---|---|---|
| 0.1% | 107.7 | 78.8 |
| 1% | 130.0 | 123.6 |
| Avg | 249.8 | 248.2 |
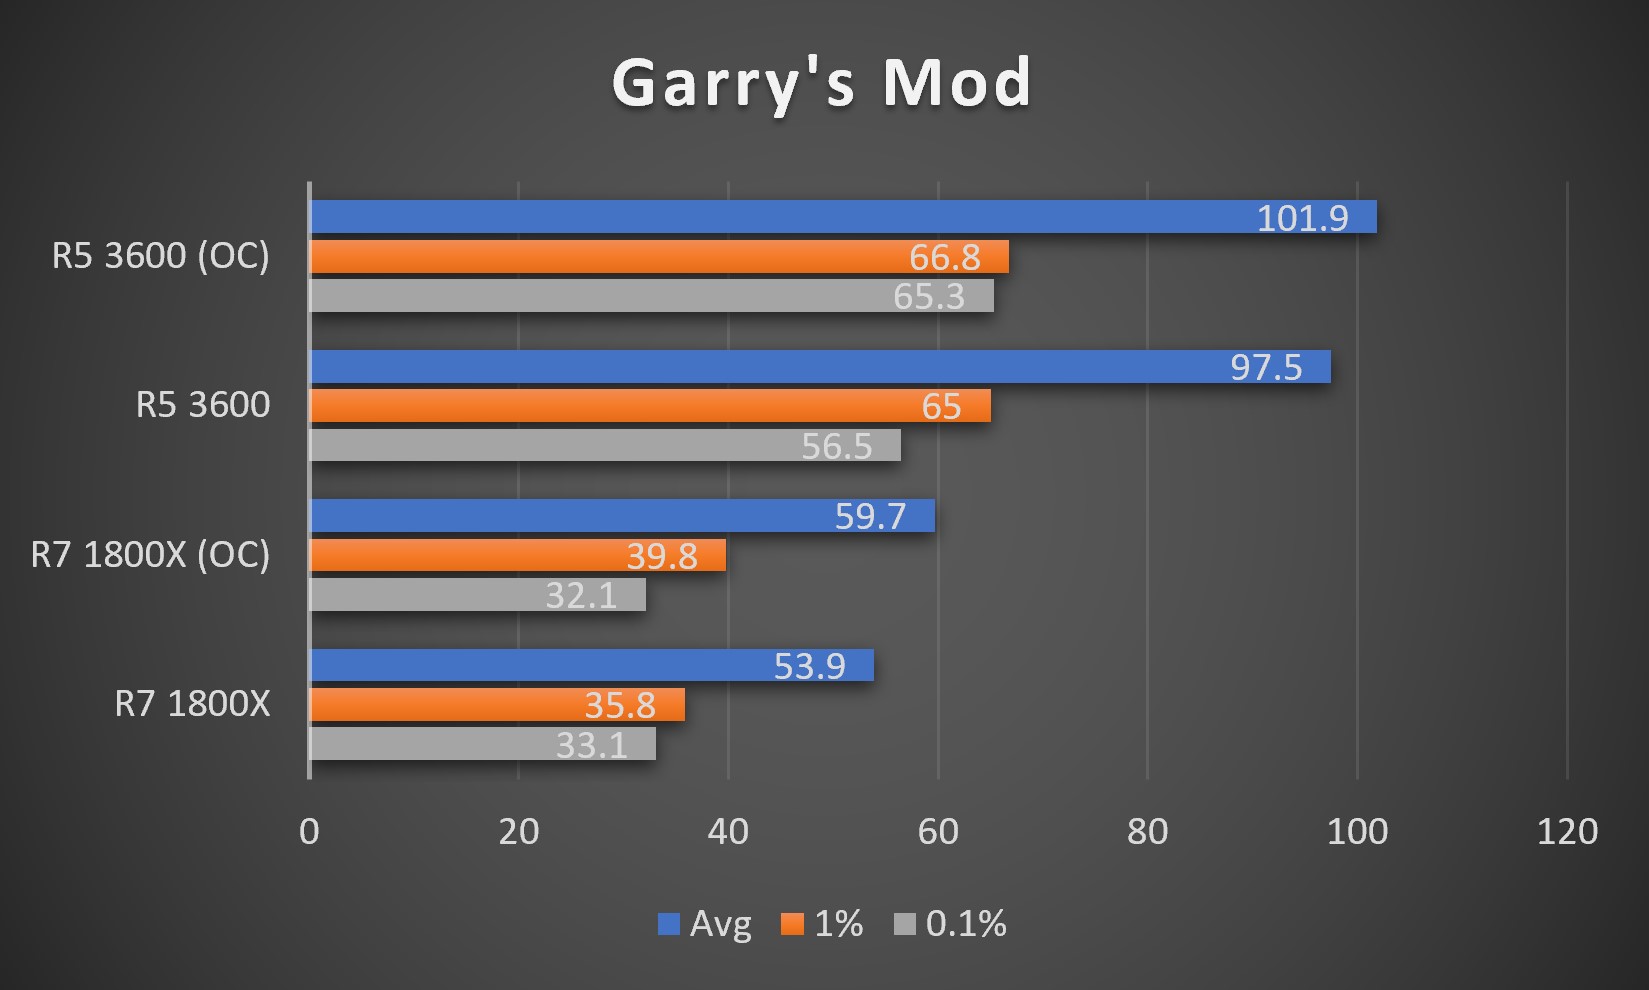
GarrysMod (gm_fork)
| R5 3600 (OC) | R5 3600 | R7 1800X (OC) | R7 1800X | |
|---|---|---|---|---|
| 0.1% | 65.3 | 56.5 | 32.1 | 33.1 |
| 1% | 66.8 | 65.0 | 39.8 | 35.8 |
| Avg | 101.9 | 97.5 | 59.7 | 53.9 |
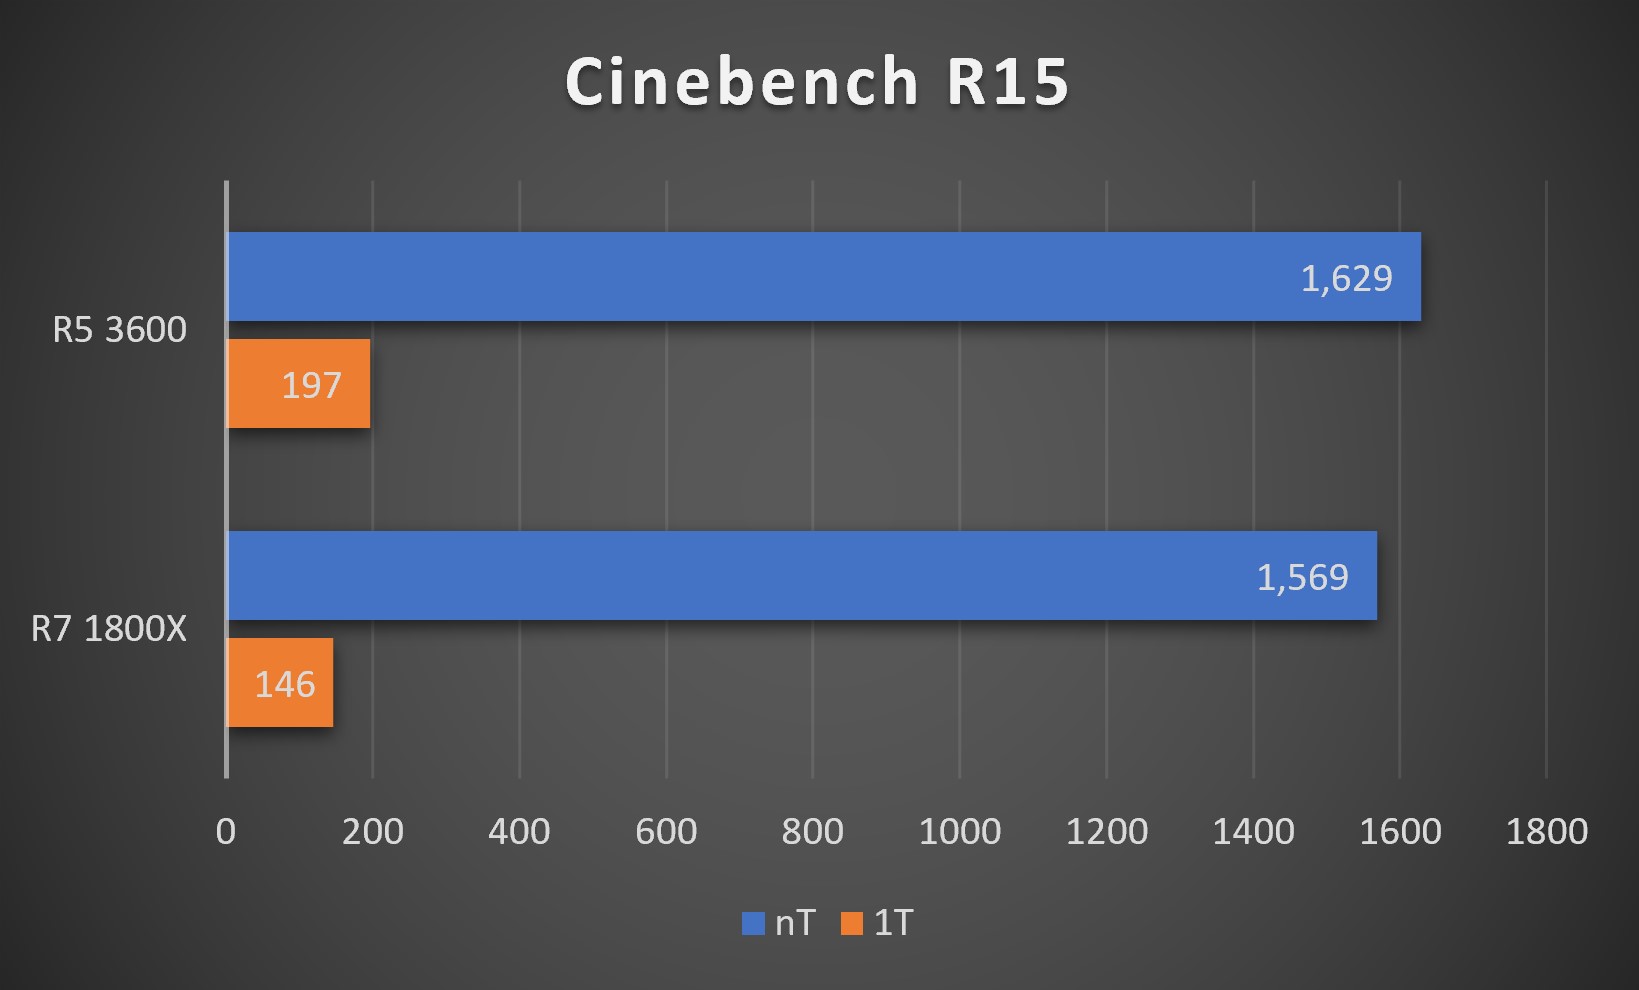
Cinebench R15
| R5 3600 | R7 1800X | |
|---|---|---|
| Single | 197 | 146 |
| Multi | 1,629 | 1,569 |
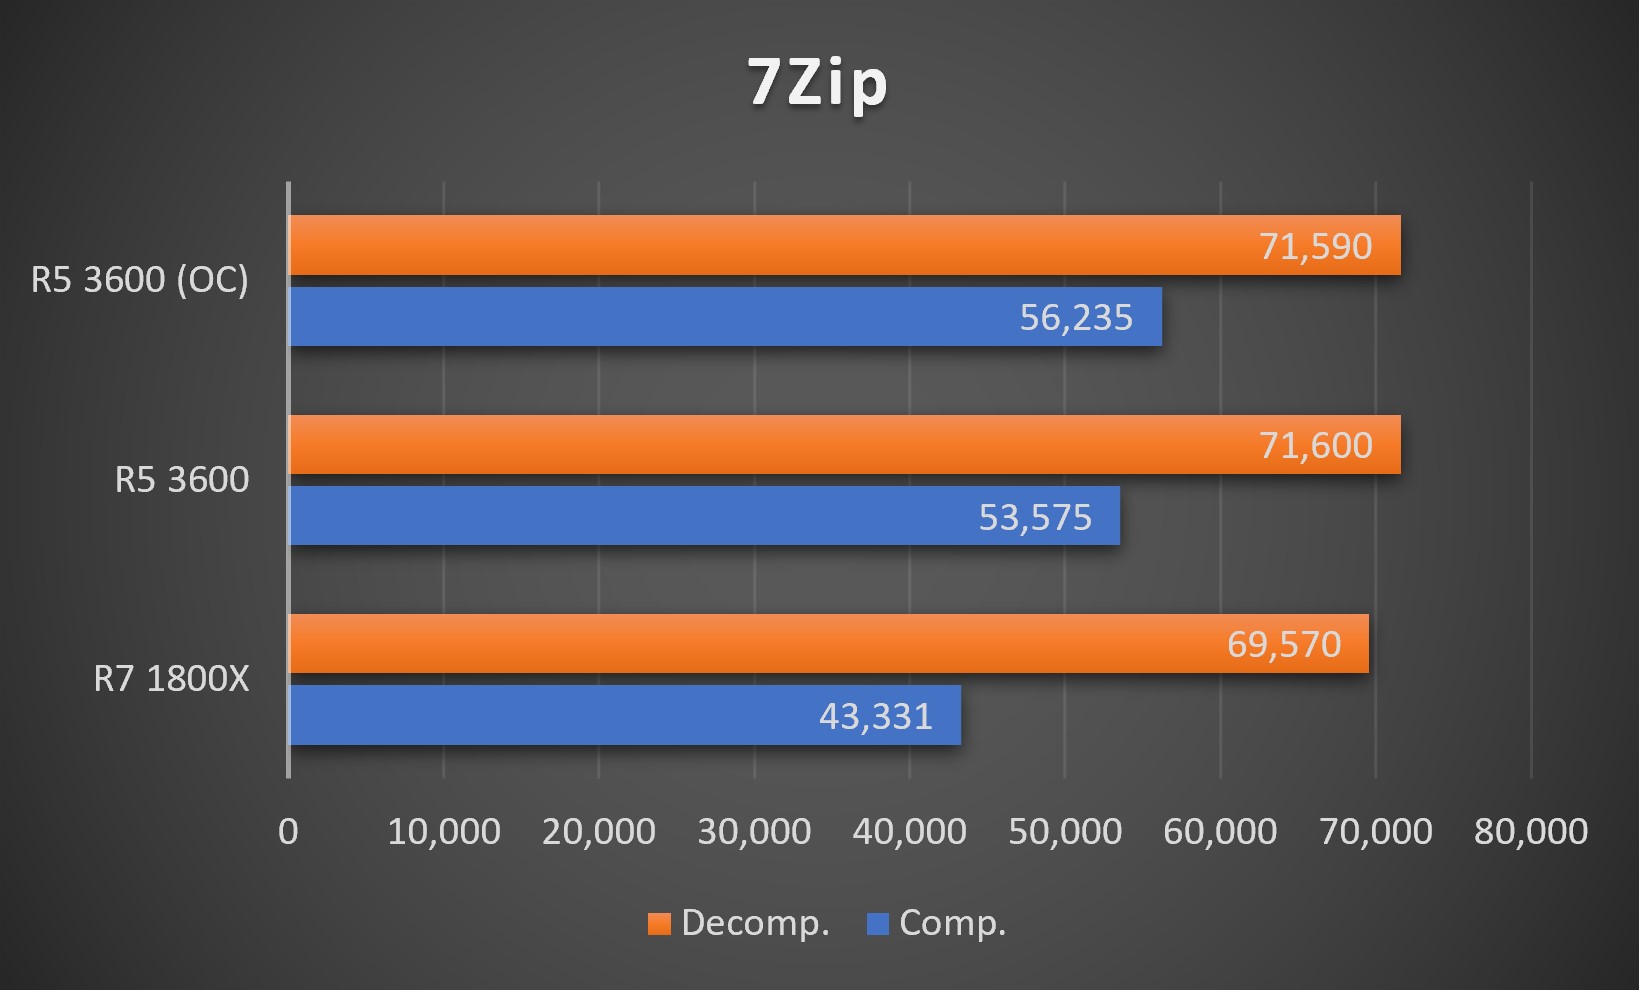
7Zip
| R5 3600 (OC) | R5 3600 | R7 1800X | |
|---|---|---|---|
| Compression | 56,235 | 53,575 | 43,331 |
| Decompression | 71,590 | 71,600 | 69,570 |
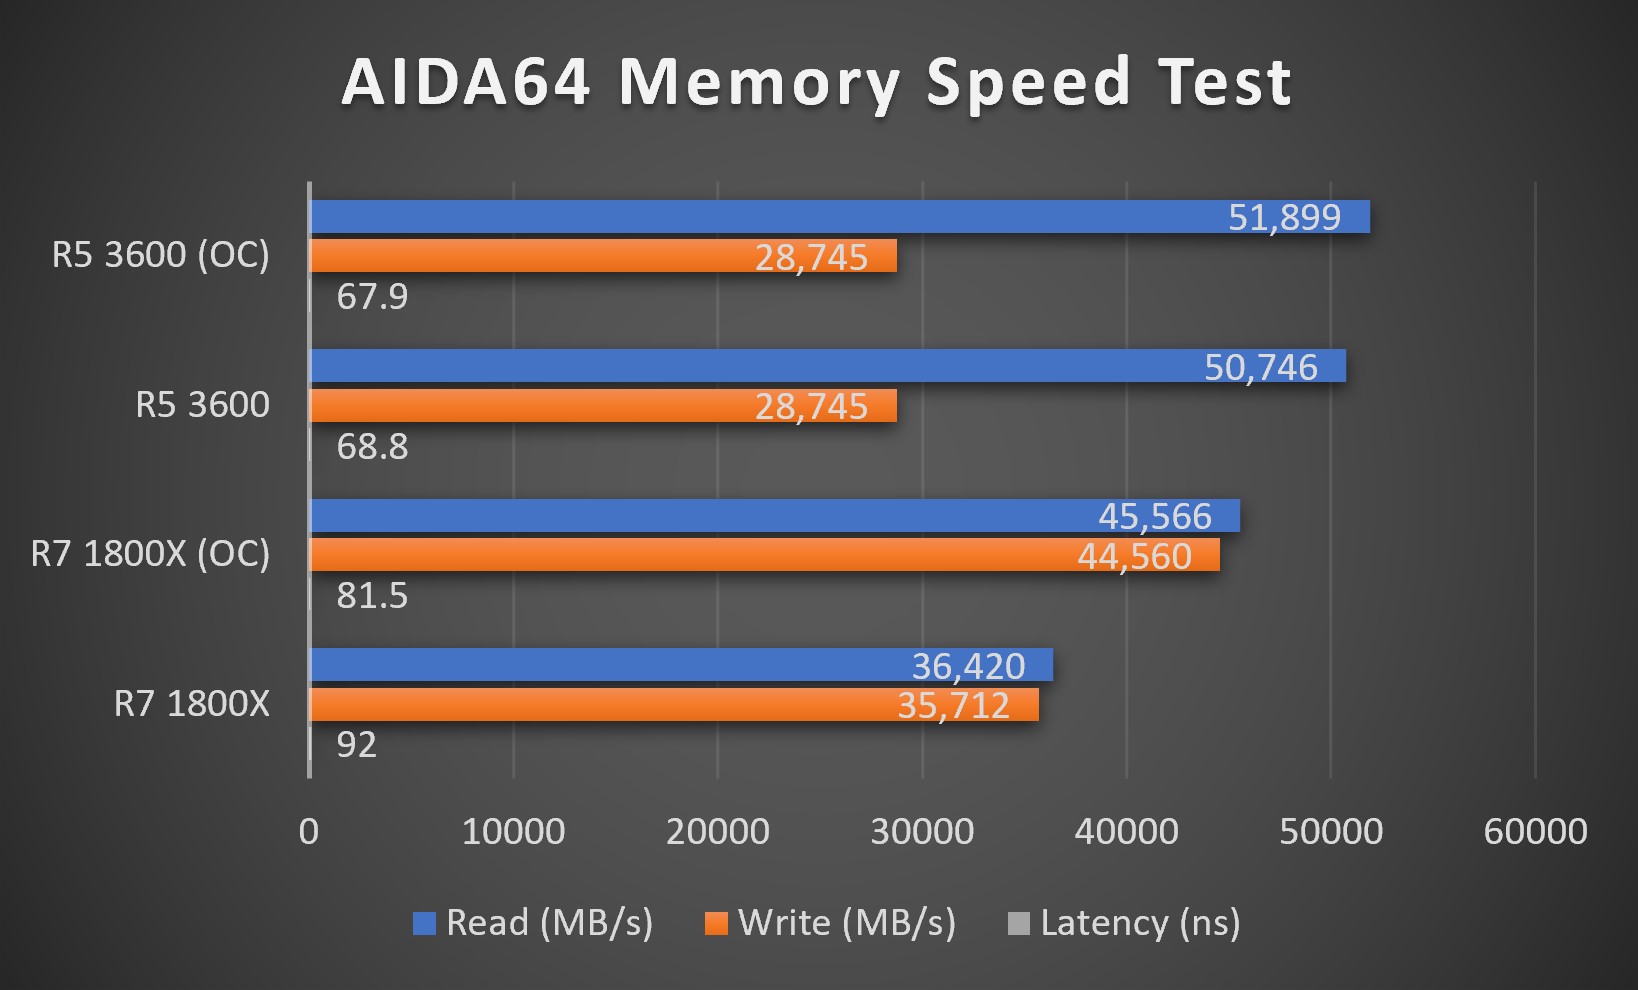
AIDA64 Memory Speed
| R5 3600 (OC) | R5 3600 | R7 1800X (OC) | R7 1800X | |
|---|---|---|---|---|
| Read (MB/s) | 51,899 | 50,746 | 45,566 | 36,420 |
| Write (MB/s) | 28,745 | 28,745 | 44,560 | 35,712 |
| Latency (ns) | 67.9 | 68.8 | 81.5 | 92.0 |
Adobe Premiere Pro Export
| R5 3600 | R7 1800X |
|---|---|
| 6m 42s | 7m 25s |
Misc. RAM scaling benchmarks